
Why trend reports are your friend.
by Rudy Boyance, Financial Management Consultant at Lift Business for the July 2022 edition of Elevator World Magazine
In my work at Lift Business Advisors, I have found that most companies fail to understand and present their data well. Once they learn how to properly gather and understand it, business — and profitability — becomes much easier. Data from a union labor rate trend report I have maintained since 1983 illustrates the need for vertical-transportation (VT) companies to increase prices. The report (Figure 1) shows that the late 1970s and early 1980s had the highest interest rates under then-President Jimmy Carter, until Paul Volcker became chair of the U.S. Federal Reserve under President Ronald Reagan and raised them even further in an effort to kill inflation. A byproduct of this was a 1982 International Union of Elevator Constructors (IUEC) five-year agreement that included a 17% pay increase in one year. If a VT company did not have a good formula for price increases in its contract to correspond with such a pay increase, it found itself losing money every month. The devil is in the details.
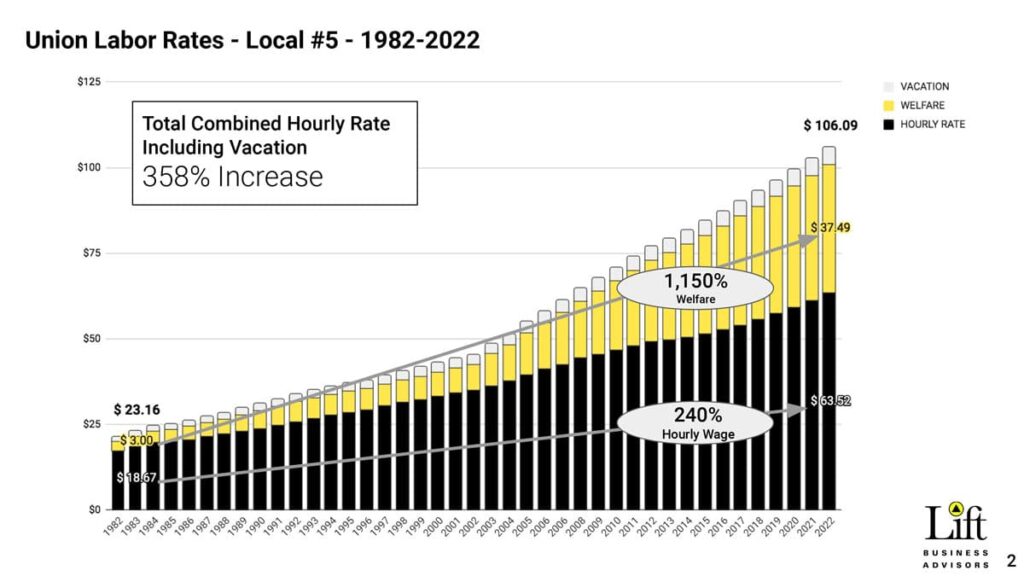
Figure 1
What has happened since? For IUEC Local 5 in Philadelphia, hourly wage went from US$18.67 in 1983 to US$63.52 today — a 240% increase. Welfare has gone from US$3 an hour to US$37.49 per hour — an increase of an astonishing 1,150%. Combined hourly rate, including vacation pay, has gone from US$23.16 per hour to US$106.09 per hour, an overall increase of 358%. Welfare in 1983 was 16% of hourly minimum wage rate. This year, welfare will be 59% of the hourly minimum wage rate. The question is, do your customer contracts protect you from the effects of inflation and pay increases?
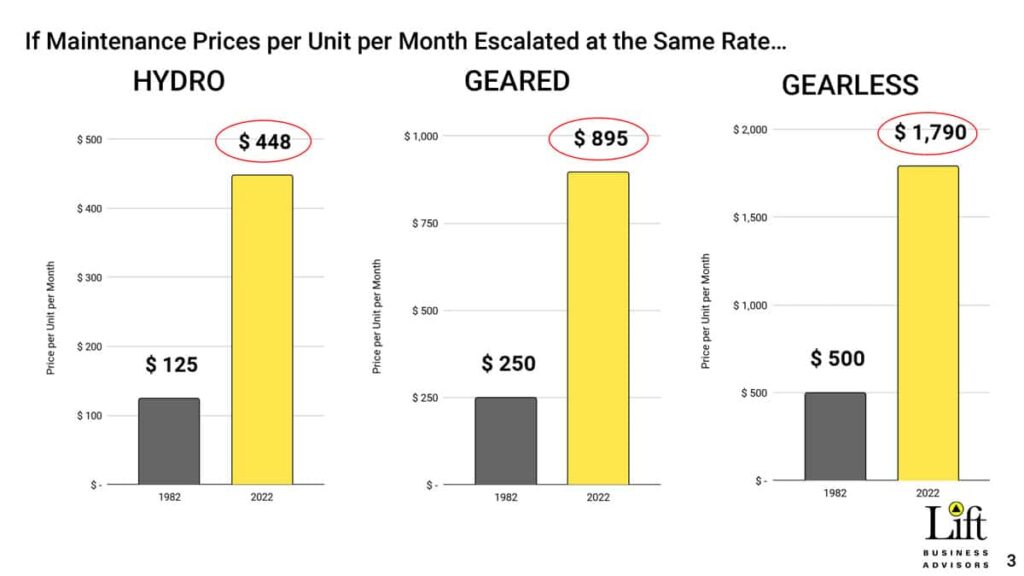
Figure 2
Figure 2 shows the prices charged for full maintenance with no callbacks on different types of equipment. If a company raised its prices annually in line with the percentage change in the labor rate, it would be getting the prices on the good (right) side of each bar graph (Hydro, Geared and Gearless). This is rare, so congratulations if you have been charging and getting these prices. We recently worked with a customer who had not raised prices in 10 years. He had an epiphany when viewing these graphs.
Many businesses fail to exhibit a monthly consistency in their financial reporting. Common problems include failing to:
- Regularly record depreciation, instead doing so at year’s end
- Record insurance pro rata increases monthly, but rather doing so when payments are made
- Record labor expenses during months in which two-three days are missing from a payroll week
- Bill modernization and construction work using the percentage-of-completion method
A company can refine its financial reporting processes and achieve both greater profit and consistency in results by using a monthly closing checklist. Figure 3 lists some of the most common areas to be checked each month. Other areas might be unique to a specific company. When a company assesses monthly performance, ideally by using trend reports, it is able to analyze accounts to interpret results and implement drivers to improve profit.
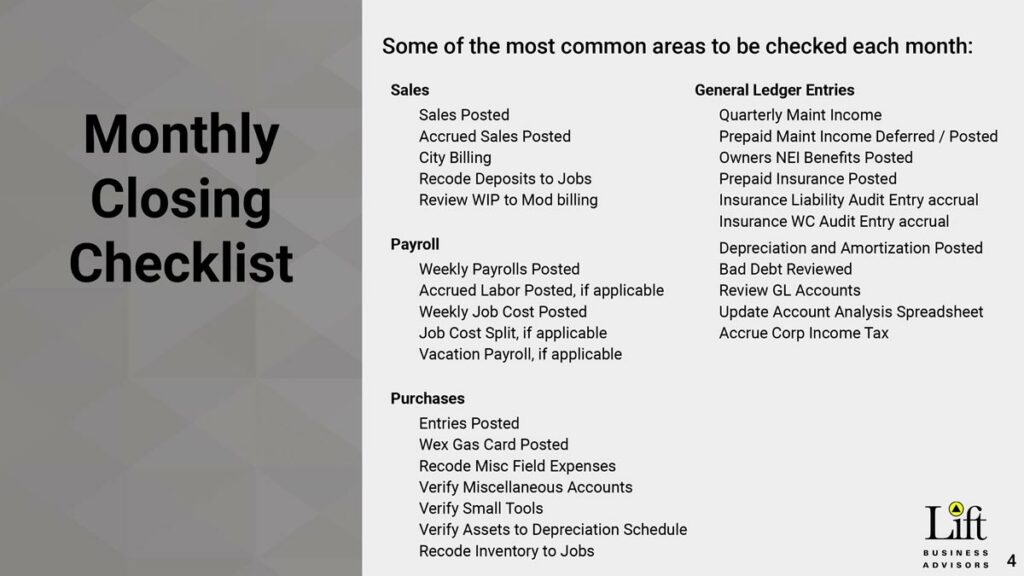
Figure 3
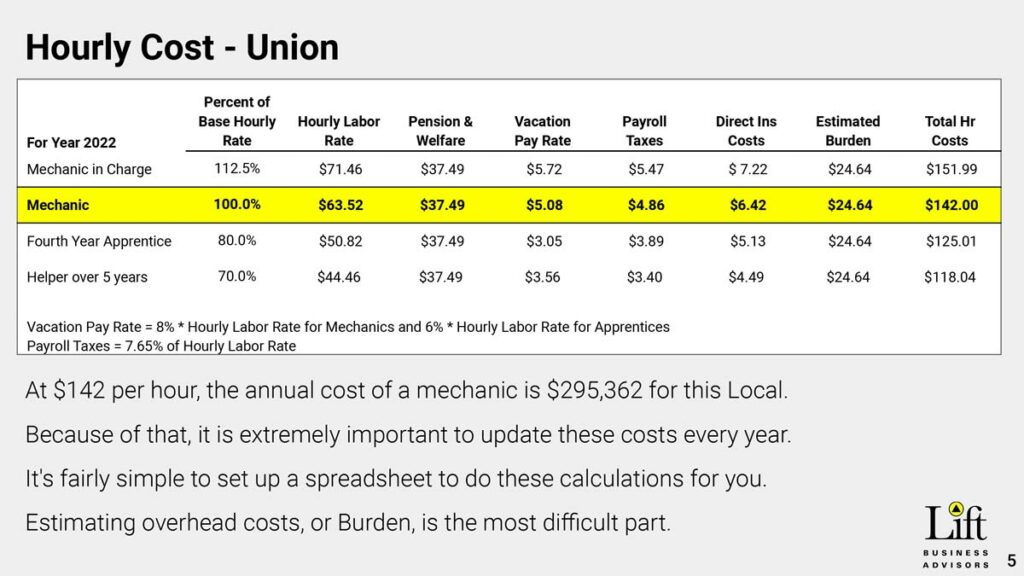
Figure 4
Calculating Hourly Cost
Figure 4 shows annual costs of mechanics and apprentices for an IUEC company, but the logic applies to non-union shops, as well. I have used this data for more than 20 years, and it takes all of 10 min to update a spreadsheet. The hourly cost is broken down into various factors, which are updated when you add pension and welfare. Vacation and payroll tax rates rarely change. Direct insurance cost is the rate a company pays annually per its liability and workman’s comp policies. The last component of hourly cost is fully burdened labor cost, which is the full hourly cost to employ a worker for the hours he or she actually works. This includes wages and the “burden” of the additional costs.[1] Calculating fully burdened labor costs helps a company make decisions about managing its workforce and, in turn, its budget.
There was a five-year period when the local IUEC did not take on any apprentices, so companies teamed up mechanics to perform modernization and new construction work. Be aware of that possibility when you are bidding jobs. Fully burdened hourly union cost is always one of the most surprising and enlightening topics we cover at Lift Business Advisors. Everything starts with cost, and there is a lack of expertise about true cost.
I have seen companies use wildly high team costs in bidding jobs because they do not know what burden is and how it’s computed. So, when bidding, they throw out a high number. Almost any union in this country has a team cost of two mechanics in the US$240-US$290 per team, per hour range. I saw a company in NYC bid US$485 per team, per hour. This company did not win many jobs. A good pricing program should be able to allocate labor, material, vacation, payroll taxes and insurance directly to jobs. What cannot be directly allocated are the items that comprise burden.
Figure 5 lists — from largest to smallest — the common accounts that cannot be directly allocated, such as labor, welfare, vacation and insurance. In this real-world example, supervisors and their benefits make up more than 40% of burden. Amounts for each account vary by month, and one should always review accounts for consistency. Reviewing this data will help a company take into account, for example, that holiday pay spikes occurred in November (possibly due to bonuses or a new hire) and that federal unemployment tax saw a spike in January. Several years of studying burden yields a feel for how much it will change from year to year.
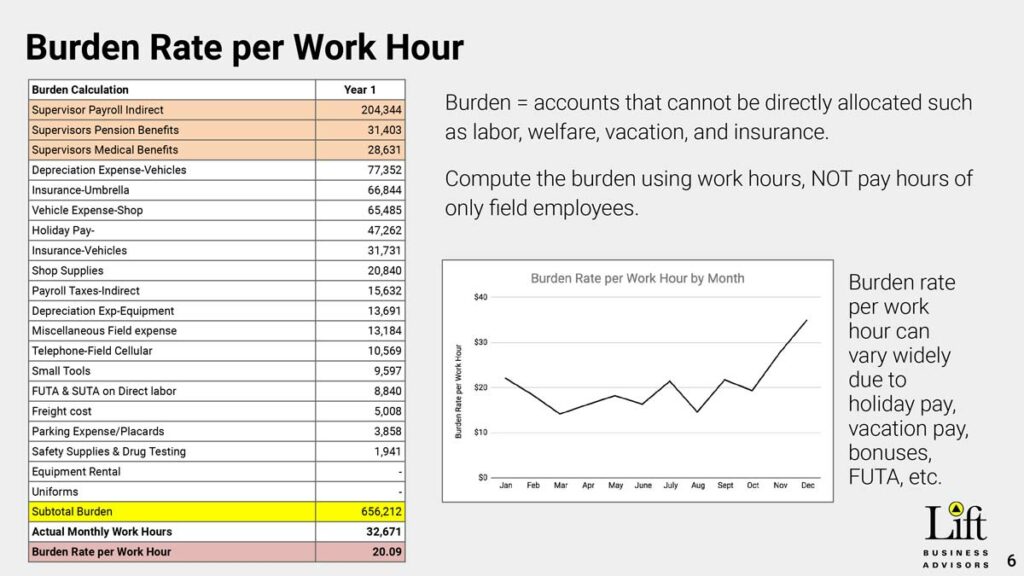
Figure 5
Creating a Chart of Accounts
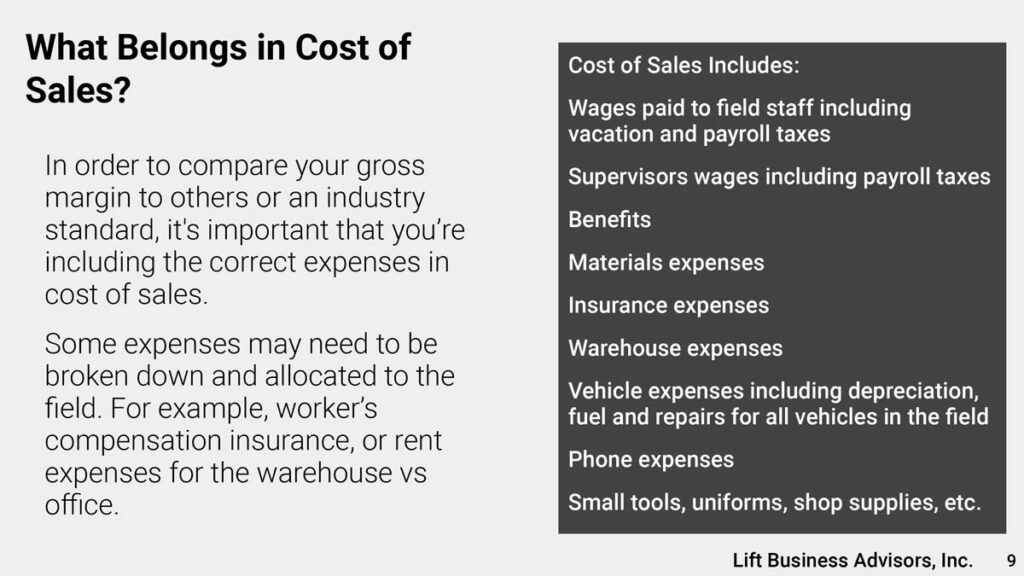
A good accounting and financial reporting system starts with a properly defined chart of accounts. Creating such a chart is difficult for many of our customers. Imagine you are sitting at a roundtable and each person states their gross margin percentage. I have seen 12%, and I have seen 70%. Is either correct? A company cannot honestly compare itself to its peers unless it is comparing apples to apples.
An example from a customer shows what should be included. Some categories, such as maintenance, are broken down into full, inspection and premium times. Main accounts can be broken down into sub-departmental accounts. Report flow will be dictated by how accounts are numbered. Items in the Cost of Goods column that make up gross margin can be broken down. For example, office rental expense could go under the Selling, General and Administrative (SGA) expense heading, while Warehouse could remain under the general Cost of Goods heading. The expense, insurance and depreciation of company vehicles driven by mechanics and field supervisors fall under Cost of Sales, rather than SGA. Office personnel driving company vehicles would have similar accounts in the SGA section of financial reports. Company cell phones may fall under office expenses and Cost of Goods. These items frequently make up the previously described burden.
EBITDA
Earnings Before Interest, Taxes, Depreciation and Amortization (EBITDA) is a method developed over the last 30 years to financially assess and compare companies. It is different from Generally Accepted Accounting Principles, or GAAP. A real-world example from a union customer implements GAAP reporting, which is suitable for financial reports to interested parties and tax filings. This particular company is fully burdened in Cost of Goods with a reasonable gross profit margin of 26.7% and net profit margin of 1.7%. Its SGA expenses are 22%, versus a “normal” range between 9-12%. I would suspect this is because company owners rewarded themselves with year-end bonuses while keeping their union cards and benefits. This, along with “keyman” insurance (an insurance policy taken out by a business to compensate that business for financial losses that would arise from the death or extended incapacity of an important member of the business)[2] could be considered excessive by outside investors.
To arrive at EBITDA, for example in a spreadsheet, we make adjustments by reversing interest, taxes, depreciation and amortization. The EBITDA results are then shown in a particular column. Since this business in not capital-intensive, think manufacturers, or companies that are heavily indebted. There is not a lot of change. Why is this important? Many companies are sold as a multiple of EBITDA. Think of EBITDA multiples the same as price-to-earnings (PE) ratios of public companies. The average PE ratio of a public company is now near 30, while the EBITDA ratio of an S&P 500 company is 14.6. EBITDA ratios vary by industry. On average, small, nonpublic companies are valued at six to seven times EBITDA. For this example, let’s assume six. In an example case, the TAAP result is US$2,303,338 for this company and the EBITDA earnings result in a value of US$3,011,311 — an increase of US$707,973.
There is disagreement about whether EBITDA is a valid metric. Two well-known investors, Warren Buffet and his partner Charlie Munger, do not believe EBITDA has value. Munger, believed to be the smarter of the two, has publicly stated that whenever you hear the word “EBITDA,” substitute the world “bull****.” EBITDA is frequently used by fast-growing, no-profit companies to improve perception of their performance. These are the type of companies that sell one dollar for 85 cents.
There is also the concept of adjusted EBITDA, where a professional, experienced consultant could and should make adjustments to a company’s EBITDA result to present it in an even-better financial light. This is useful in bargaining with outside companies.
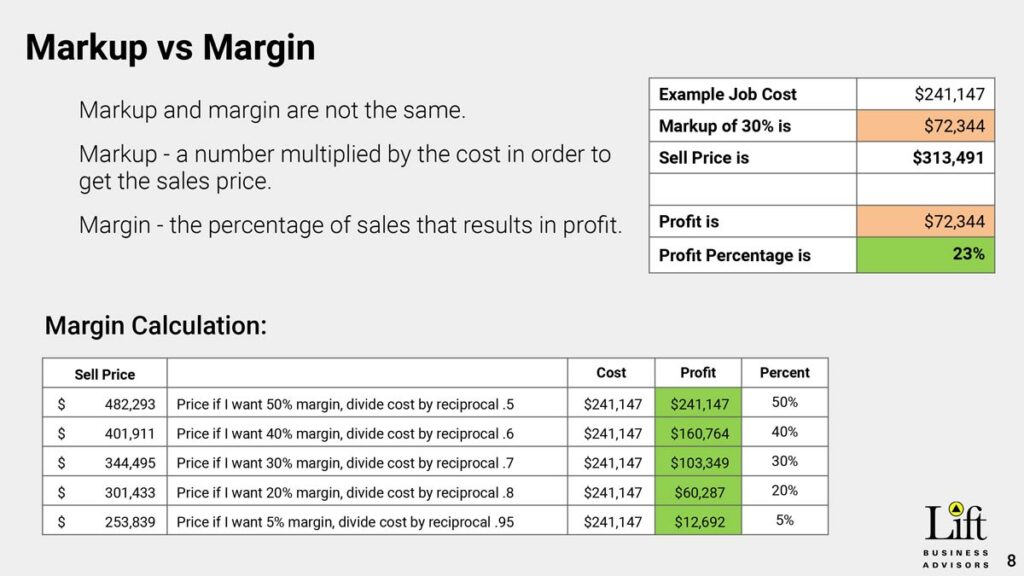
Markup and Margin
A two-car traction mod job bid to a customer highlights the difference between markup versus margin. Cost can be adjusted for team makeup (one or more mechanics) or geographic area. When team hours are entered into a particular spreadsheet column for each step of a project, the cost is automatically filled in in another column. If job performance is analyzed upon completion of each step of a job, a company can improve its estimating for future better results. Otherwise, you might have a line that says “my job hours run over by 14%, so I am going to have to put a buffer into that account for any future jobs. Listing the material use per car shows cost, per car, to do this job results in a total of US$241,147. With a 30% markup, my sale price for both cars together is US$313,491, giving me a profit of US$72,344, or 23%. To make 30% profit, I would divide cost by 0.70, 40% by 0.60 and, if for some reason I wanted to make 5%, by 0.95.”
Gross Trend Forecast
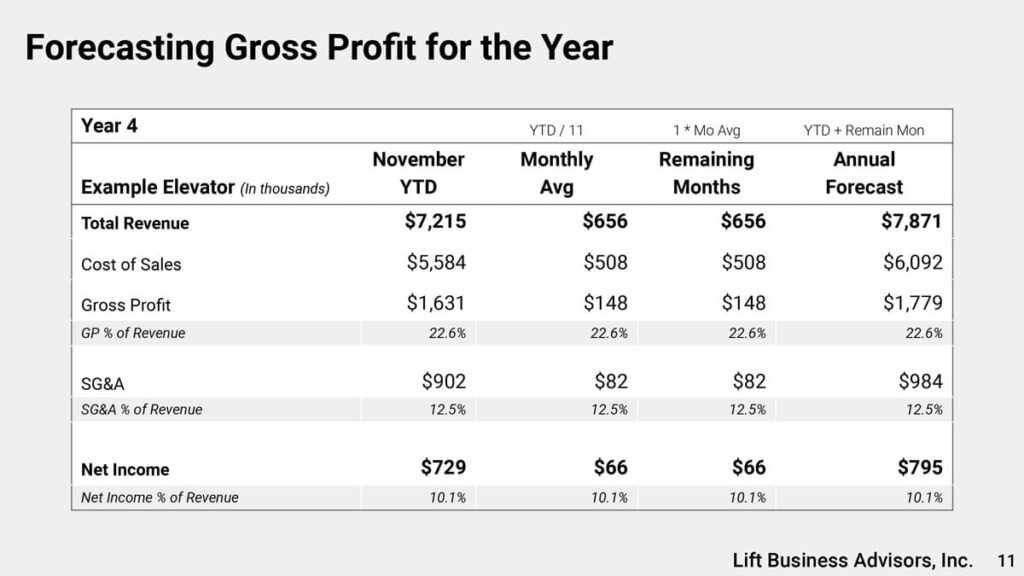
Now that hourly cost and burden have been defined, let’s see what gross market consists of, how it affects EBITDA and markup versus gross margin. A real-world example of monthly results using a trend formula facilitates easy comparison of accounts month by month. If your only guide to how your business is doing is the amount of cash in the bank at the present time, then the business is managing you; you are not managing the business.
Reviewing an 11-month worksheet line by line, column by column, shows 11 months will provide a monthly results average by dividing the figure in a particular column by the year-to-date number. Thus, you may accurately estimate your year-end result and drive improvement. This, of course, works best when you are compiling and completing the monthly checklist mentioned earlier.
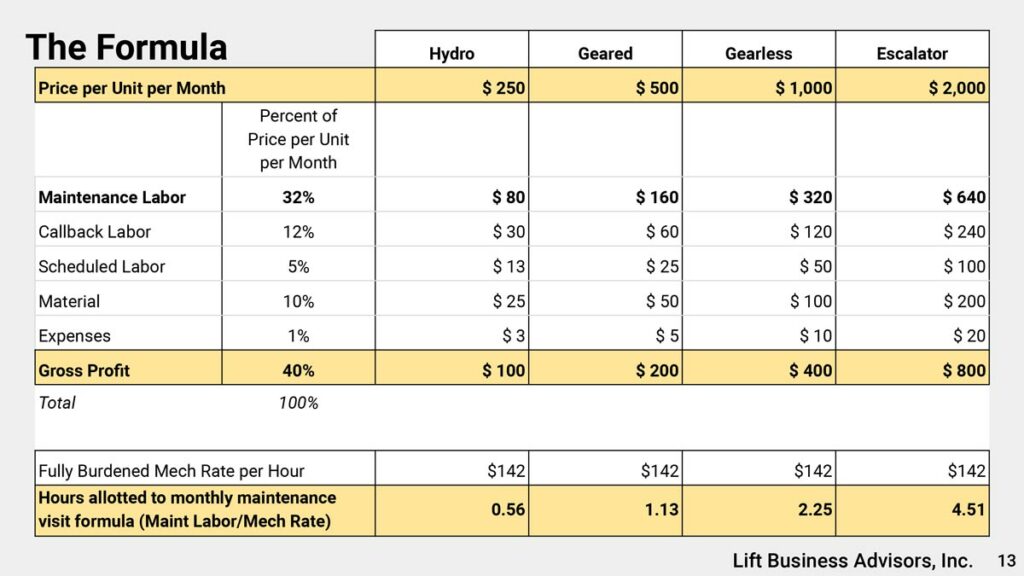
The Formula
In 1984, a company for which I prepared a financial report had 10 maintenance mechanics. They were concerned maintenance was not getting done and that another employee was needed. The company had two sales/owners and two tech/owners. The tech owners said “hire,” and the sales owners said “do not.” The mid-1980s also saw the introduction of electronic spreadsheets. So I suggested we list all jobs with unit counts and tech owners list how many hours they thought each job required. All job hours were then totaled.
The question became how many hours could the company schedule an employee to work in a month, allowing for callbacks. The answer was 32 hours a week, or 139 hours a month. Taking the total job hours and dividing that by 139 suggested we needed eight mechanics — not 10 — so two mechanics were laid off. That resulted in US$160,000 being added to the company’s bottom line, since each mechanic had a fully burdened annual cost of US$80,000. Further study resulted in another two mechanics being laid off, bringing the total bottom-line savings to US$320,000. The important outcome here was right-sizing the workforce to achieve profit.
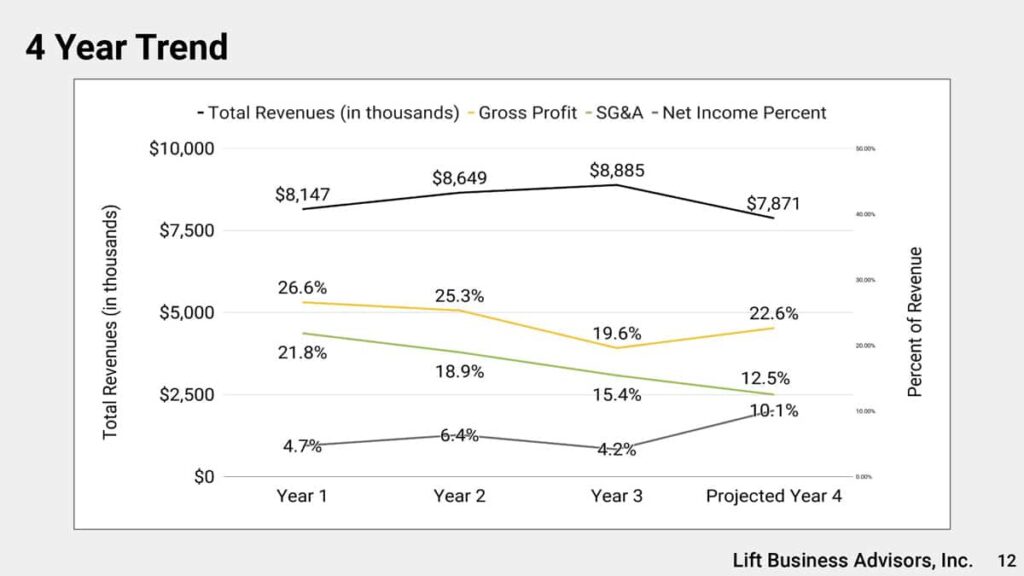
Year Trend
In preparing my year-end financials, my outside accountant always uses three years. Frequently, your insurance, banking and bonding company ask for the most recent three years. Trend reports allow you to see the changes in your business.
Reference
[1] smallbusiness.chron.com/calculate-fully-burdened-labor-costs-33072.html